> ## Documentation Index
> Fetch the complete documentation index at: https://documentation.onesignal.com/llms.txt
> Use this file to discover all available pages before exploring further.
# Analytics overview
> Measure message performance, user engagement, and conversions in OneSignal. Covers dashboards, attribution models, trends, and data export.
## Overview
OneSignal provides analytics to measure message performance, track user engagement over time, and attribute downstream business outcomes like purchases and sign-ups. You can view analytics in the Dashboard, retrieve them through the API, stream real-time events to your own systems using Event Streams, or export data to CSV.
Message reports and aggregate trends are covered below. Jump to other analytics features:
Send real-time message events like sent, opened, clicked, and dismissed to your data warehouse or analytics tools.
Export message and user data to CSV for offline analysis.
Measure conversion, drop-off, and performance across multi-step Journeys.
Aggregate analytics across many messages sent from the same Template.
Measure business impact like revenue and sign-ups with cross-channel last-touch attribution.
Set a target metric on a Journey and track progress on the Journey report.
Map dashboard, API, CSV, and Event Streams metric names for each channel.
### Which analytics should I use?
Choose the right analytics tool based on your goal. Most teams use more than one depending on whether they are optimizing campaigns, debugging delivery, or analyzing long-term behavior.
| Your goal | Use this |
| - | - |
| Review performance of a single message in the dashboard | [Message reports](#message-reports) |
| Aggregate performance across similar messages, ideal for transactional messages | [Template analytics](./template-analytics) |
| Measure conversion across a Journey | [Journey analytics](./journeys-analytics) |
| Track engagement trends over time in the dashboard | [Engagement trends](./engagement-analytics) |
| Monitor user subscription status changes by channel | [Subscription trends](./subscription-trends) |
| See how often users open your app and how long they stay | [Sessions volume](./sessions-volume) |
| Measure whether users come back to your app over time | [Retention metrics](./retention-metrics) |
| Measure downstream actions like purchases or sign-ups | [Conversion metrics](./conversion-metrics) |
| Send real-time message events to your own analytics stack | [Event Streams](./event-streams) |
| Analyze data across multiple OneSignal apps | [Event Streams](./event-streams) to a centralized warehouse. See [cross-app analytics](./apps-organizations#how-can-we-access-analytics-messages-and-users-across-multiple-apps) |
| Export data for offline analysis | [Exporting data](./exporting-data) |
| Track whether a Journey met your target metric | [Goals](./goals) |
| Look up what a dashboard, API, CSV, or Event Streams label means | [Metrics glossary](./analytics-metrics-glossary) |
***
## Message reports
Every message sent through OneSignal has a message report showing delivery, engagement, and outcome metrics for that specific send. Message reports cover a single message. They do not aggregate data across multiple messages.
Navigate to **Messages > All messages** and select a message to view its report, or retrieve reports programmatically using the [View messages API](/reference/view-messages) and/or [Export audience activity CSV](/reference/export-csv-of-events).
If you send messages using Journeys or Templates, use [Journey analytics](./journeys-analytics) and/or [Template analytics](./template-analytics) to see aggregated performance instead of reviewing each message individually.
Delivery, opens, clicks, confirmed receipt, and outcomes for push notifications.
Impressions, clicks, dismissals, and conversion metrics for in-app messages.
Sends, opens, clicks, bounces, and unsubscribes for email messages.
Delivery, clicks, failures, and opt-outs for SMS/RCS messages.
Updates, clicks, engagement, and lifecycle events for Live Activities.
***
## Aggregate trends
Aggregate trends show how message and user activity changes over time across your entire app. These charts help you identify seasonality, spikes, or long-term engagement changes.
For [billing related](./billing-faq) plan usage (sends by channel, MAU, and billing limits), see:
* **App > Settings > Usage** for app-level message volume
* **Organization settings > Billing** for plan limits and usage across apps
### Engagement trends
Use Engagement Trends to track message sends, deliveries, opens, clicks, and unsubscribes across all messages. Engagement Trends do not show performance for individual messages. Use [message reports](#message-reports) for a single send.
Navigate to **Analytics > Engagement** to view these charts. Track:
* Sends and deliveries (labeled "Impressions" for in-app messages)
* Opens and clicks
* Unsubscribes
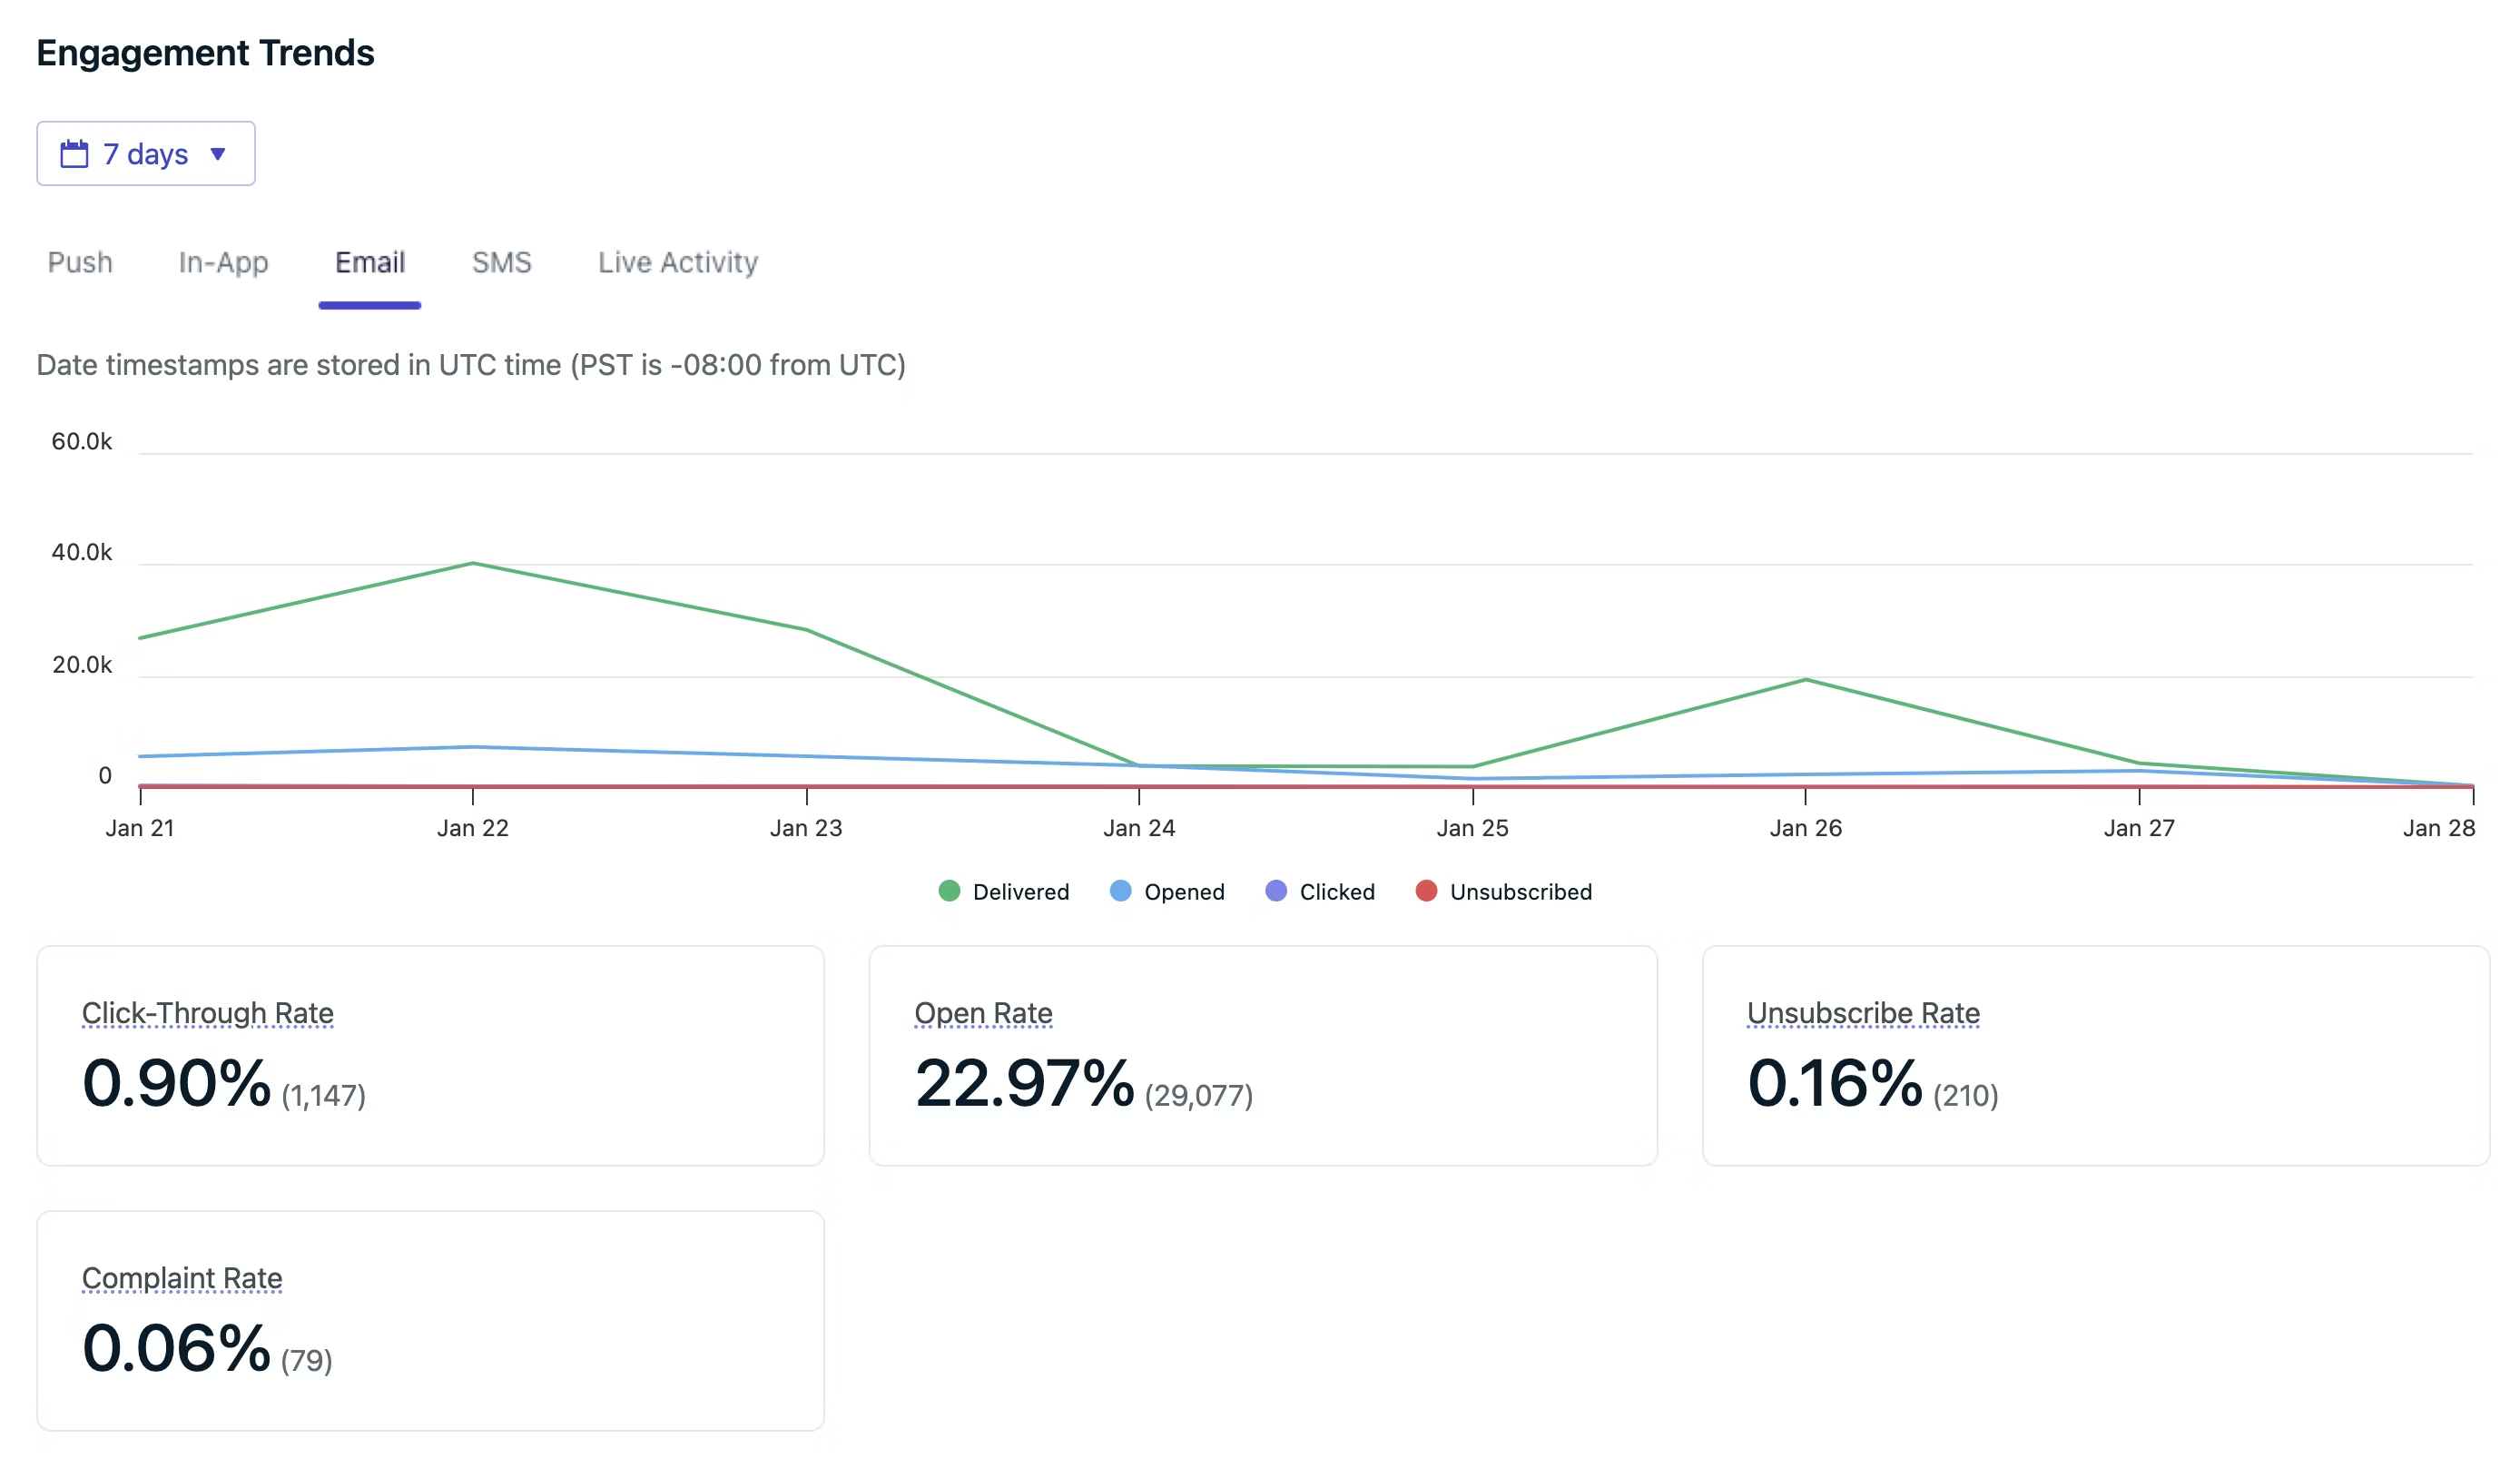 Track message sends, opens, clicks, and unsubscribes over time.
### Subscription trends
Use Subscription Trends to see how Subscriptions subscribe and unsubscribe over time, broken down by channel. Subscription Trends track opt-in and opt-out activity. They do not track message engagement like opens or clicks. Use [Engagement Trends](#engagement-trends) for open and click rates.
Navigate to **Analytics > Subscriptions** to view these charts. Each of subscribes and unsubscribes gets its own chart.
Track subscribe and unsubscribe activity over time, including Total subscribed, Subscribes, and Unsubscribes.
### Retention
Use Retention to see what percentage of the users active on a chosen date came back on the days after. Pick a date, and everyone with a session that day becomes the cohort the chart follows forward. Retention does not measure message engagement like opens or clicks. Use [Engagement Trends](#engagement-trends) for open and click rates.
Navigate to **Analytics > Sessions & Retention** to view this chart. For how to read curve shapes and compare channel or platform series, see [Interpreting retention curves](./interpreting-retention-curves).
Measure whether users come back after a given day, broken down by channel and platform.
### Sessions volume
Use Sessions volume to see how many sessions your app or website had each day, with total sessions and average session duration for the window. Sessions volume counts every session, whether or not it is attributed to a message.
Navigate to **Analytics > Sessions & Retention** to view this chart. It appears below the User retention chart.
Track total sessions and average session duration across your app.
***
## Conversion metrics
Conversion Metrics measure the business impact of your messaging by tracking what users do after interacting with messages, such as purchases, sign-ups, or content views.
You define which [Custom Events](./custom-events) count as conversions, and OneSignal attributes those conversions to messages using a **last-touch attribution** model across all channels (push, email, SMS, in-app, and RCS).
Conversion Metrics replaces the legacy [Custom Outcomes](./custom-outcomes) feature. If you are setting up conversion tracking for the first time, use [Conversion metrics](./conversion-metrics).
Full details on the attribution model, qualifying interactions per channel, attribution windows, and setup instructions.
### Legacy outcomes
[Custom Outcomes](./custom-outcomes) is being deprecated. Legacy outcomes data remains accessible as historical data but will not appear on the new Conversion Metrics charts.
The legacy Custom Outcomes feature uses a different attribution model that only covers push notifications and in-app messages:
| Attribution | When it applies |
| - | - |
| **Direct** | The user clicked the in-app message block or push notification, which launched a new session (app was closed >30s), and triggered the outcome. |
| **Influenced** | The user did **not** click a push notification, but opened the app within the influence window (default: 24 hours) and triggered the outcome. Applies to the 10 most recent push notifications. |
| **Unattributed** | The outcome occurred outside of any attribution window or click. Not linked to a specific message. |
***
## FAQ
### How long is message data retained?
| Message Type | Retention Period |
| - | - |
| Dashboard-sent messages | Lifetime of the app |
| API-sent messages | 30 days |
| Audience activity CSV | 30 days |
| Journeys messages | See [Journeys analytics](./journeys-analytics) |
### How do I aggregate data across multiple messages?
Each message has a unique message ID, which makes manual aggregation via the API possible but inefficient.
**Recommended approach**:
* Use [Templates analytics](./template-analytics) to aggregate performance across related messages sent from the same Template.
* Use [Journeys analytics](./journeys-analytics) to aggregate performance across related Journeys.
### How do I view analytics across multiple apps?
OneSignal analytics are scoped to a single app. There is no built-in cross-app dashboard. To analyze data across multiple apps, use [Event Streams](./event-streams) to route message events from each app to a centralized data warehouse like Snowflake, BigQuery, or Amplitude. From there you can join and query across apps.
For more options including cross-app user data and messaging, see the full breakdown in [Apps, Organizations, & Accounts FAQ](./apps-organizations#how-can-we-access-analytics-messages-and-users-across-multiple-apps).
This documentation is built and hosted on [Mintlify](https://mintlify.com), a developer documentation platform.
Track message sends, opens, clicks, and unsubscribes over time.
### Subscription trends
Use Subscription Trends to see how Subscriptions subscribe and unsubscribe over time, broken down by channel. Subscription Trends track opt-in and opt-out activity. They do not track message engagement like opens or clicks. Use [Engagement Trends](#engagement-trends) for open and click rates.
Navigate to **Analytics > Subscriptions** to view these charts. Each of subscribes and unsubscribes gets its own chart.
Track subscribe and unsubscribe activity over time, including Total subscribed, Subscribes, and Unsubscribes.
### Retention
Use Retention to see what percentage of the users active on a chosen date came back on the days after. Pick a date, and everyone with a session that day becomes the cohort the chart follows forward. Retention does not measure message engagement like opens or clicks. Use [Engagement Trends](#engagement-trends) for open and click rates.
Navigate to **Analytics > Sessions & Retention** to view this chart. For how to read curve shapes and compare channel or platform series, see [Interpreting retention curves](./interpreting-retention-curves).
Measure whether users come back after a given day, broken down by channel and platform.
### Sessions volume
Use Sessions volume to see how many sessions your app or website had each day, with total sessions and average session duration for the window. Sessions volume counts every session, whether or not it is attributed to a message.
Navigate to **Analytics > Sessions & Retention** to view this chart. It appears below the User retention chart.
Track total sessions and average session duration across your app.
***
## Conversion metrics
Conversion Metrics measure the business impact of your messaging by tracking what users do after interacting with messages, such as purchases, sign-ups, or content views.
You define which [Custom Events](./custom-events) count as conversions, and OneSignal attributes those conversions to messages using a **last-touch attribution** model across all channels (push, email, SMS, in-app, and RCS).
Conversion Metrics replaces the legacy [Custom Outcomes](./custom-outcomes) feature. If you are setting up conversion tracking for the first time, use [Conversion metrics](./conversion-metrics).
Full details on the attribution model, qualifying interactions per channel, attribution windows, and setup instructions.
### Legacy outcomes
[Custom Outcomes](./custom-outcomes) is being deprecated. Legacy outcomes data remains accessible as historical data but will not appear on the new Conversion Metrics charts.
The legacy Custom Outcomes feature uses a different attribution model that only covers push notifications and in-app messages:
| Attribution | When it applies |
| - | - |
| **Direct** | The user clicked the in-app message block or push notification, which launched a new session (app was closed >30s), and triggered the outcome. |
| **Influenced** | The user did **not** click a push notification, but opened the app within the influence window (default: 24 hours) and triggered the outcome. Applies to the 10 most recent push notifications. |
| **Unattributed** | The outcome occurred outside of any attribution window or click. Not linked to a specific message. |
***
## FAQ
### How long is message data retained?
| Message Type | Retention Period |
| - | - |
| Dashboard-sent messages | Lifetime of the app |
| API-sent messages | 30 days |
| Audience activity CSV | 30 days |
| Journeys messages | See [Journeys analytics](./journeys-analytics) |
### How do I aggregate data across multiple messages?
Each message has a unique message ID, which makes manual aggregation via the API possible but inefficient.
**Recommended approach**:
* Use [Templates analytics](./template-analytics) to aggregate performance across related messages sent from the same Template.
* Use [Journeys analytics](./journeys-analytics) to aggregate performance across related Journeys.
### How do I view analytics across multiple apps?
OneSignal analytics are scoped to a single app. There is no built-in cross-app dashboard. To analyze data across multiple apps, use [Event Streams](./event-streams) to route message events from each app to a centralized data warehouse like Snowflake, BigQuery, or Amplitude. From there you can join and query across apps.
For more options including cross-app user data and messaging, see the full breakdown in [Apps, Organizations, & Accounts FAQ](./apps-organizations#how-can-we-access-analytics-messages-and-users-across-multiple-apps).
This documentation is built and hosted on [Mintlify](https://mintlify.com), a developer documentation platform.